Data Logging
Up to 8 freely configurable parameters can be logged internally on the EMpro energy measuring device.
Status
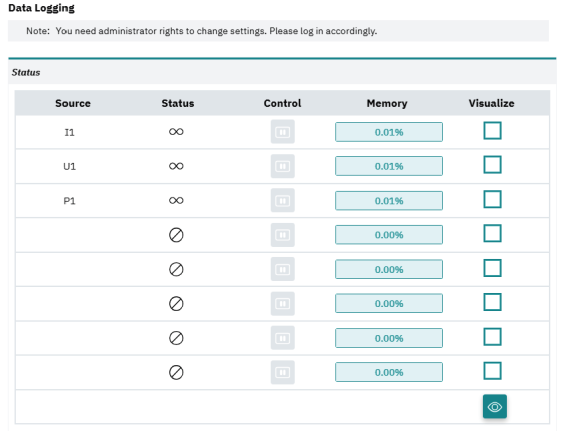
| Status |
|
| Control |
Pause and restart a data log. |
| Memory |
Shows how much % of the memory of a data log is already occupied. |
| Visualize |
Select checkbox and click on the „👁️“ button in the status section to get the data log visualized (Chart view / Table view) |
 Logging channel is not configured
 Logging channel is recording
 Logging channel is paused/stopped
 Logging channel is full (only if circular buffer is disabled)
 Logging channel is waiting (for start time of scheduler)
 Logging channel is corrupted
Settings
|
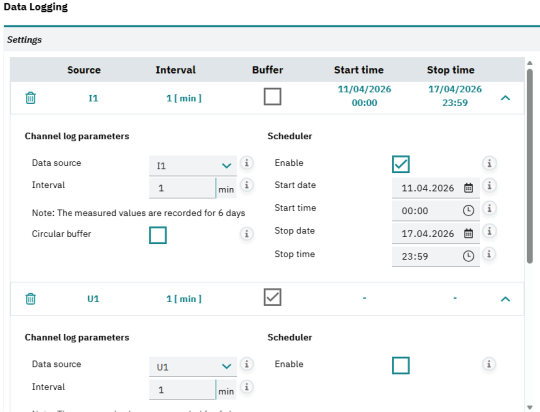
Log 1...8 |
Here, you can configure up to eight different logging parameters. |
|
Data source |
Select the desired electrical parameter for the logging from the drop-down menu. |
|
Interval |
Enter the interval time in minutes. The shortest duration that can be set is 1 minute. The maximum logging duration depends on the configured interval. For an interval of 15 minutes, the logging capacity is approx. 90 days. If you shorten the interval, the logging capacity is also reduced (e.g., 10 minute interval/60 days logging capacity). |
|
Circular buffer |
Activate the circular buffer if you want to use the FIFO principle (first-in/first-out) for the data logging. Deactivate the circular buffer if you want to define a fixed starting point. The logging automatically stops once the memory is full. |
| Scheduler |
Define the time period (Start date, Start time & Stop date, Stop time) for the parameter to be recorded. If the time period specified is longer than data can be saved, Stop date and Stop time have no function and are not reached (if circular buffer is deactivated). |
- For instantaneous values as selected electrical parameter average values over the interval are formed and stored.
- For meter readings as selected electrical parameter the current value is stored.
- Minimum and maximum values that occur during the intervals are also saved.
- Any changes to the settings of a started log will delete the previously recorded data. A warning message indicates this and must be confirmed before the setting changes are applied.
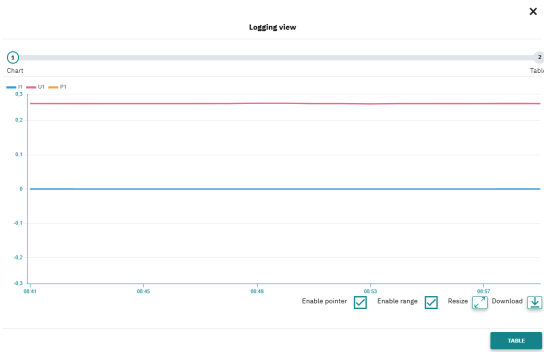
You can view all configured logging data as a chart in the web server even without having to be logged in.
With your mouse, you can zoom in on the saved data.
By means of
- “Enable pointer” checkbox being selected, the values for the graphs are displayed at the position where the mouse is located.
- “Enable range” checkbox being selected, min and max values (captured during the intervals) are additionally displayed for the logged parameters.
- “Resize” button being pressed, you can zoom out of the saved data.
- “Download” button being pressed, you can also export the logging data as CSV, XLS or TXT file.